#MAASL00149

[Maximum Mark: 6]

There is a set of data with  items.

The sum of the items is  and the mean is

The standard deviation of the data set is . Each value in the set is multiplied by

a) Find

b)i)Find the value of the new mean

ii)Find the new variance
#MAASL00156

[Maximum Mark: 6]

A data set has n items. The sum of the items is 500 and the mean is 25.

The standard deviation of this data set is 5. Each value in the set is multiplied by 10.

a) Find n.

b) Write down the value of the new mean.

b) Find the value of the new variance.
#MAASL00245
[Maximum Mark: 6]
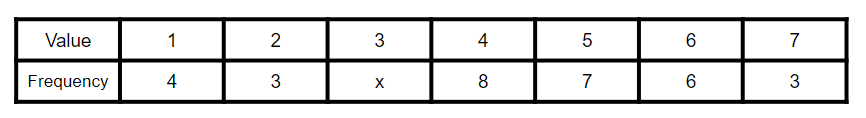
The values in the frequency distribution below have a mean of 4.24.
a) What is the value of ?
b) Find the value of the standard deviation.
#MAASL00246

[Maximum Mark: 6]

The values in the frequency distribution below have a mean of 4.89.


a) What is the value of ?

b) Find the value of the standard deviation.
#MAASL00247

[Maximum Mark: 8]

This histogram displays the data collected about the number of moves in a 87 chess matches.


a)  is assigned to the frequency of , and  is assigned to the frequency of , where  is the number of moves. Find the values of  and .

b) Write down the median class.

c) What are the interval width and the mid-interval value of the fourth interval?

d) Find the mean and the standard deviation of the data set.
#MAASL00248

[Maximum Mark: 8]

This histogram displays the data collected about the height of a randomly selected group of adult males, in cm.


a)  is assigned to the frequency of , and  is assigned to the frequency of , where  is representative of height, in cm. Find the values of  and .

b) Write down the median class.

c) What are the interval width and the mid-interval value of the second interval?

d) Find the mean and the standard deviation of the data set.
#MAASL00249

[Maximum Mark: 6]

Consider the following list of integers: 2, x, y, 13, 26, z

The mode is 2, the median is 11, and the mean is 18.

a) What is the value of ?

b) What is the value of ?

c) What is the value of ?
#MAASL00250

[Maximum Mark: 6]

Consider the following list of integers: 3, 8, x, 45, y, z

The mode is 45, the median is 28, and the mean is 36.

a) What is the value of ?

b) What is the value of ?

c) What is the value of ?
#MAASL00251

[Maximum Mark: 6]

A group of 11 children competed to find the most Easter eggs. Their scores are as following:

1, 4, 5, 6, 6, 7, 8, 10, 14, 16, 17

a) Find the mode.

b) Find the median.

c) Find the upper quartile.

d) Find the interquartile range.
#MAASL00252

[Maximum Mark: 6]

A group of 15 people were asked how many pets they have had over their lifetimes. They reported the following numbers:

1, 2, 3, 4, 4, 4, 5, 8, 9, 11, 14, 14, 17, 19, 23

a) Find the mode.

b) Find the median.

c) Find the upper quartile.

d) Find the interquartile range.
items. The sum of the items is
 items.
The sum of the items is
items.
The sum of the items is  and the mean is
  The standard deviation of the data set is
  . Each value in the set is multiplied by
  a) Find
  ) Write down the value of the new mean.
b
) Write down the value of the new mean.
b ) Find the value of the new variance.
 a) What is the value of
 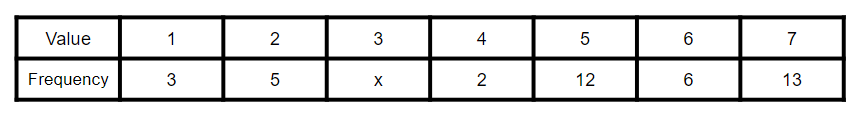 a) What is the value of
  a)
a)  is assigned to the frequency of
  , and
, and  is assigned to the frequency of
  , where
  is the number of moves. Find the values of
 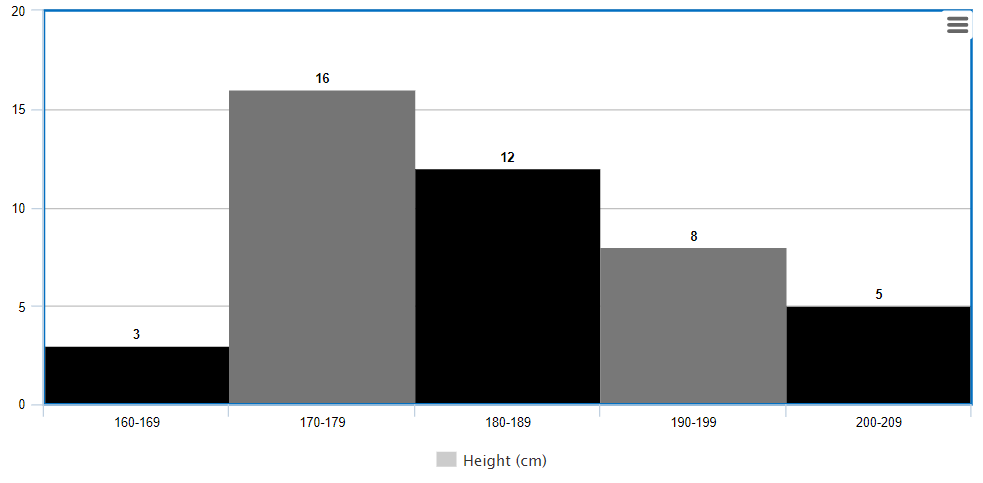 a)
a)  , and
, and  , where
  ?
b) What is the value of
?
b) What is the value of  ?
?