Measurements and Uncertainty - Topic 1

Bite-sized Measurements and Uncertainty Study Notes for IB Physics HL/SL 

Share on facebook
Facebook
Share on twitter
Twitter
Share on linkedin
LinkedIn
Share on reddit
Reddit
Share on email
Email

Table of Contents

Measurements in Physics

Key points

  • The fundamental units of the SI system are: ampere, Kelvin, kilogram, meter, mole, and second (along with candela which is not needed for IB Physics)
    • Always convert to these units.
  • Numbers that are very big or very small can be expressed in powers of 10 (scientific notation)
    • Become familiar with the corresponding metric prefixes.
  • There are seven fundamental units of the SI system, six of which are used for the IB.
    • Luminous Intensity is measured in candela (cd) but is not used in the IB curriculum
  • Whenever working with any relevant quantities, convert all given values to these units. 
Quantity Name Symbol
Length Meter m
Mass Kilogram kg
Time Second s
Electric Current Ampere A
Thermodynamic Temperature Kelvin K
Amount of Substance Mole mol
Power Prefix Symbol
10-12 Pico- p
10-9 Nano- n
10-6 Micro- µ
10-3 Milli- m
10-2 Centi- c
103 Kilo- k
106 Mega- M
109 Giga- G
  • Small or large quantities can be expressed in terms of units that are related to the basic ones by powers of 10
    • This is known as scientific notation 
  • Each power has a prefix associated with it shown to the table on the left.
    • mirco, milli, Kilo, etc. are known as metric prefixes.
      • Become familiar with their names, symbols, and corresponding powers.
  • Expressing a quantity as a plain power of 10 gives what is called the order of magnitude of that quantity
    • This can be used to find the ratio between two different quantities 

Key point

  • Significant Figures are used to indicate the quantity of something to a reliable and necessary amount of digits (A more precise way of rounding).
    • If not specified, always give your answer on IB exams to 3 significant figures. 

The number of digits used to express a number carries information about how precisely the number is known

  • For example, a stopwatch reading of 3.2s is less precise than a reading of 3.22 seconds

For some values, a number should be more precise (more significant figures), and for others, a number should be less precise (less significant figures)

How many significant figures are used in IB Physics? If not specified, always give your answer on IB exams to 3 significant figures. 

There are certain rules which need to be followed to measure the significant figures of a number

  • All non-zero (1-9) digits are significant.
  • Zeroes between non-zero digits are significant.
  • A trailing zero or final zero in the decimal portion only are significant.

A nice trick to help is the Pacific-Atlantic Rule:

  • The rule states that if a decimal point is Absent, then the zeroes on the Atlantic/right side are insignificant. If a decimal point is present, then the zeroes on the Pacific/left side are insignificant.

Key point

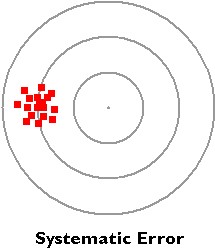
  • A systematic error is an error that is introduced by an inaccuracy in a lab procedure than by random occurrence.
    • Systematic errors displace data measurements from their true value in the same direction and by the same magnitude.
    • Inconsistencies in the y-intercept of the graphed data is often indicative of systematic error.

What is systematic error in physics? A systematic error is a type of error that affects the accuracy of data collected in an experiment.

Systematic errors displace data measurements from their true value in the same direction and by the same magnitude; for example, all the measurements may all be too large or too small.

  • This displacement or “shift” affects the intercepts of the graph for the data.
    • A non-zero y intercept where an intercept of (0,0) is expected is indicative of systematic error in the data collection process.

In the bulls eye example to the right, all of the data points are skewed to the left, where they are supposed to be at the center.

Systematic errors are commonly associated with set-up error such as improper calibration. A common example may be:

  • An electric scale that is not set to zero before measuring any masses. 
 

Frequently Asked Questions

  • How can systematic error be reduced, minimized, or eliminated?
    • It cannot be completely eliminated, as no lab procedure is perfect.
    • Minimize it by calibrating equipment, warming up instruments, and comparing measured values against accepted values/standards.

Key point

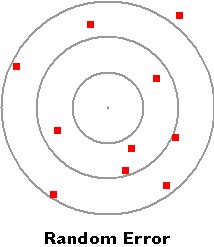
  • A random error is an error that is introduced by random occurrence.
    • It affects the precision of the data.
    • Commonly referred to as human error, but in labs, you must be more specific.
  • What is random error in physics? A random error is the other type of error present in labs, which is caused by random occurrences in the measuring environment. 

Random error is revealed when repeated measurements of the same quantity show a spread of values, some too large some too small. The independent data values differ in both magnitude and direction from the mean.

  • The graphed data would have large error bars with significant presence of random errors.

In the bullseye example to the right, the data points are scattered from the mean, which would be somewhere in the middle.

Random errors are commonly associated with environmental changes and measuring procedures. Examples:

  • Measuring the height of something while viewing it from a slightly different angle each time.
  • Exerting force on an object that is simply supposed to be dropped.
    • These issues are often labeled as ‘human error’, but in a physics lab, you must be more specific.

Frequently Asked Questions

  • How can random error be reduced, minimized, or eliminated.
    • Like systematic error, random error cannot be eliminated, because no testing conditions or procedures are perfect.
    • Reduce/minimize random error by taking repeated measurements, to plot as many data points as possible and obtain the best possible line of best fit once the data is graphed. Also, maintain good and consistent experimental technique.
      • Consider using apparatus when possible, as they provide more consistency than a human conducting the experiment.


Key points

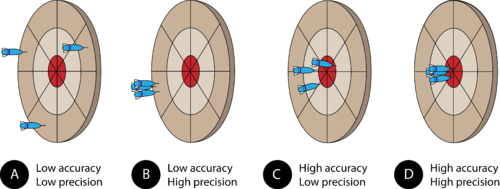
  • Accurate measurements are close to an accepted value, and are “near the bullseye”.
  • Precise measurements are close to each other.

Measurement accuracy refers to how close the data collected is to an accepted value. The accuracy of measurement is dependent on the presence of systematic error.

Measurement precision refers to how close the data points collected are to each other. This is dependent on random error between trials.

Bullseye example:

  •  In example A, the data points are far from the bullseye and are far apart.
    • Low accuracy and low precision.
  • In example D, the data points are all right on the bullseye.
    • High accuracy and high precision.

Frequently Asked Questions

  • How can precision and/or accuracy be increased in a scientific experiment?
    • Since precision is dependent on random error, and accuracy on systematic error, they can be increased by improving the data collection process to reduce both types of error.
  • Why are precision and accuracy important in a scientific experiment?
    • They are directly indicative of the quality of the data collected, and by extension, all analysis and conclusions.

Key point

  • The average is the best estimate for the quantity x based on the N measurements
    • Also referred to as the mean
  • In an experiment, measurements are repeated many times. To find a single value, an average must be taken.
    • These are the values used in graphing.
  • Averages are also used to estimate the uncertainty
    • i.e. half the difference between the smallest and largest value (range).
      • This is called data uncertainty, and used to calculate the vertical error bars.
    • Uncertainties are generally expressed in one significant figure
      • Having more significant figures show the level of confidence of an experimenter
Means, Averages, and Uncertainty Definitions IB

Key points

  • Absolute Uncertainty
  • Fractional Uncertainty
  • Percentage Uncertainty

Absolute Uncertainty is the uncertainty in a measurement, which is represented in the relevant units

  • Absolute Errors can be called an Approximation Error

Fractional Uncertainty  is the Absolute Uncertainty divided by the standard quantity itself

Percent Uncertainty  is the Absolute Uncertainty divided by the measurement, times 100%

  • This is also the fractional uncertainty times 100 percent

Key points

  • Uncertainty represented in graph
  • Minimum and Maximum Lines

Uncertainty is often represented through error bars in graphs.

  • This uncertainty is usually found by determining the random error of a data set

The Minimum and Maximum lines are part of the line of best fit. They are found for linear lines

  • To draw the Minimum and Maximum lines, you draw a line such that it goes through all the error bars
  • If a line is not linear, it must be linearized to draw all the lines of best fit.

Key points

  • Vector- a quantity that has magnitude and direction
  • Scalar- a quantity that has only magnitude, and not direction
  • Vector– a quantity that has magnitude and direction
Vector Examples IB
Scalar Examples IB
  • Scalar– a quantity that has magnitude but not direction

Multiplying a Scalar value and a Vector

  •  Multiplying a vector by a scalar can change both the direction and magnitude
  • Direction is based on whether or not the Scalar value is positive or negative
  • The Magnitude of the Vector is affected by the Magnitude of the Scalar Value
Multiplying a Vector by a Scalar IB

Key point

  • Vectors that are added involves shifting the direction of both vectors in order to find the ‘least distance traveled’

Adding is much like adding numbers, numerically speaking.

  • Everything builds on top of eachother
  • This can be seen graphically, usually through the ‘least distance traveled’
Addition of Vectors

Key points

  • Subtracting Vectors can be seen graphically, usually as the shortest distance traveled
  • Subtracting vectors can also be represented numerically, as 1 vector is subtracted from another

Subtracting vectors is represented graphically as the shortest distance traveled from one end of a vector to another end of a vector

Subtraction of Vectors

There are steps that can help with subtracting vectors

  1. Draw both vectors such that they start at a common point
  2. Draw a line of ‘shortest distance’ from one end of a vector to the other end of the vector
  3. The vector from the first tip to the second tip will be represented numerically as vector 2 minus vector 1

Key points

  • The vertical component is with respect to the y-axis.
  • The horizontal component is with respect to the x-axis.

The Vertical Component is the component with respect to the y-axis.

  • Most factors will have a vertical component unless stated otherwise.
Vertical Components
Horizontal Components

The Horizontal Component is the component with respect to the x-axis.

  • Most factors will have a horizontal component unless stated otherwise.

Formula Booklet

Horizontal Components and Vertical Components Formulas IB
Representing the vector components numerically derivates from the unit circle, where cos is used for the x-values and sin is used for the y-values.

Uncertainty Worksheet

Measurements and Uncertainty PPT

Uncertainty PPT

Power Point Presentation

Subscribe to the Inertia Newsletter

IB News, Covid-19 Updates, Deadlines, Tips and Tricks, and Hundreds of Free Resources are Awaiting You!

Copyright © InertiaLearning, LLC. All rights reserved.

Share the joy with your friends:

Share on facebook
Facebook
Share on twitter
Twitter
Share on reddit
Reddit
Share on whatsapp
WhatsApp
Share on email
Email