Uncertainties & Errors - Topic 1.2
Table of Contents
Key point
- A systematic error is an error that is introduced by an inaccuracy in a lab procedure than by random occurrence.
- Systematic errors displace data measurements from their true value in the same direction and by the same magnitude.
- Inconsistencies in the y-intercept of the graphed data is often indicative of systematic error.
What is systematic error in physics? A systematic error is a type of error that affects the accuracy of data collected in an experiment.
Systematic errors displace data measurements from their true value in the same direction and by the same magnitude; for example, all the measurements may all be too large or too small.
- This displacement or “shift” affects the intercepts of the graph for the data.
- A non-zero y intercept where an intercept of (0,0) is expected is indicative of systematic error in the data collection process.
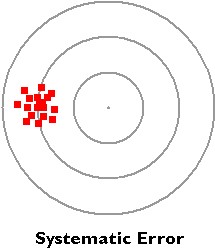
In the bulls eye example to the right, all of the data points are skewed to the left, where they are supposed to be at the center.
Systematic errors are commonly associated with set-up error such as improper calibration. A common example may be:
- An electric scale that is not set to zero before measuring any masses.
Frequently Asked Questions
- How can systematic error be reduced, minimized, or eliminated?
- It cannot be completely eliminated, as no lab procedure is perfect.
- Minimize it by calibrating equipment, warming up instruments, and comparing measured values against accepted values/standards.
Key point
- A random error is an error that is introduced by random occurrence.
- It affects the precision of the data.
- Commonly referred to as human error, but in labs, you must be more specific.
- What is random error in physics? A random error is the other type of error present in labs, which is caused by random occurrences in the measuring environment.
Random error is revealed when repeated measurements of the same quantity show a spread of values, some too large some too small. The independent data values differ in both magnitude and direction from the mean.
- The graphed data would have large error bars with significant presence of random errors.
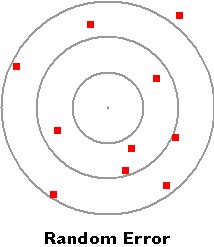
In the bullseye example to the right, the data points are scattered from the mean, which would be somewhere in the middle.
Random errors are commonly associated with environmental changes and measuring procedures. Examples:
- Measuring the height of something while viewing it from a slightly different angle each time.
- Exerting force on an object that is simply supposed to be dropped.
- These issues are often labeled as ‘human error’, but in a physics lab, you must be more specific.
Frequently Asked Questions
- How can random error be reduced, minimized, or eliminated.
- Like systematic error, random error cannot be eliminated, because no testing conditions or procedures are perfect.
- Reduce/minimize random error by taking repeated measurements, to plot as many data points as possible and obtain the best possible line of best fit once the data is graphed. Also, maintain good and consistent experimental technique.
- Consider using apparatus when possible, as they provide more consistency than a human conducting the experiment.
Key points
- Accurate measurements are close to an accepted value, and are “near the bullseye”.
- Precise measurements are close to each other.
Measurement accuracy refers to how close the data collected is to an accepted value. The accuracy of measurement is dependent on the presence of systematic error.
Measurement precision refers to how close the data points collected are to each other. This is dependent on random error between trials.
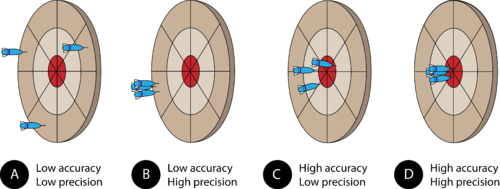
Bullseye example:
- In example A, the data points are far from the bullseye and are far apart.
- Low accuracy and low precision.
- In example D, the data points are all right on the bullseye.
- High accuracy and high precision.
Frequently Asked Questions
- How can precision and/or accuracy be increased in a scientific experiment?
- Since precision is dependent on random error, and accuracy on systematic error, they can be increased by improving the data collection process to reduce both types of error.
- Why are precision and accuracy important in a scientific experiment?
- They are directly indicative of the quality of the data collected, and by extension, all analysis and conclusions.
Key point
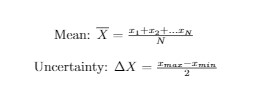
- The average is the best estimate for the quantity x based on the N measurements
- Also referred to as the mean
- In an experiment, measurements are repeated many times. To find a single value, an average must be taken.
- These are the values used in graphing.
- Averages are also used to estimate the uncertainty
- i.e. half the difference between the smallest and largest value (range).
- This is called data uncertainty, and used to calculate the vertical error bars.
- Uncertainties are generally expressed in one significant figure
- Having more significant figures show the level of confidence of an experimenter
- i.e. half the difference between the smallest and largest value (range).
Key points
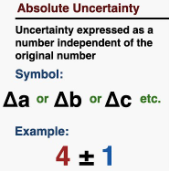
- Absolute Uncertainty
- Fractional Uncertainty
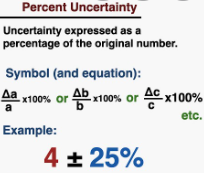
- Percentage Uncertainty
Absolute Uncertainty is the uncertainty in a measurement, which is represented in the relevant units
- Absolute Errors can be called an Approximation Error
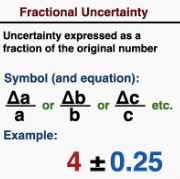
Fractional Uncertainty is the Absolute Uncertainty divided by the standard quantity itself
Percent Uncertainty is the Absolute Uncertainty divided by the measurement, times 100%
- This is also the fractional uncertainty times 100 percent
Key points
- Uncertainty represented in graph
- Minimum and Maximum Lines
Uncertainty is often represented through error bars in graphs.
- This uncertainty is usually found by determining the random error of a data set
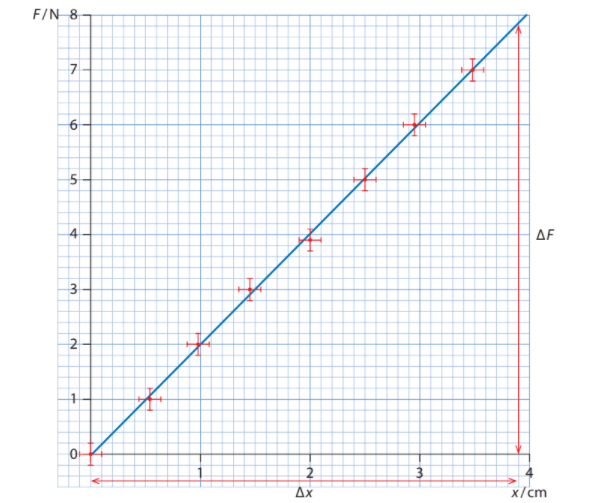
The Minimum and Maximum lines are part of the line of best fit. They are found for linear lines
- To draw the Minimum and Maximum lines, you draw a line such that it goes through all the error bars
- If a line is not linear, it must be linearized to draw all the lines of best fit.
Subscribe to the Inertia Newsletter
IB News, Covid-19 Updates, Deadlines, Tips and Tricks, and Hundreds of Free Resources are Awaiting You!
Features
- Study Notes
- Thousands of IB Questions
- Detailed Answers
- Ask-A-Question System

