Averages
Key point
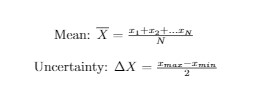
- The average is the best estimate for the quantity x based on the N measurements
- Also referred to as the mean
- In an experiment, measurements are repeated many times. To find a single value, an average must be taken.
- These are the values used in graphing.
- Averages are also used to estimate the uncertainty
- i.e. half the difference between the smallest and largest value (range).
- This is called data uncertainty, and used to calculate the vertical error bars.
- Uncertainties are generally expressed in one significant figure
- Having more significant figures show the level of confidence of an experimenter
- i.e. half the difference between the smallest and largest value (range).

Subscribe to the Inertia Newsletter
IB News, Covid-19 Updates, Deadlines, Tips and Tricks, and Hundreds of Free Resources are Awaiting You!
Features
- Study Notes
- Thousands of IB Questions
- Detailed Answers
- Ask-A-Question System

