Best-fit lines

Best-fit lines

Key points

  • Uncertainty represented in graph
  • Minimum and Maximum Lines

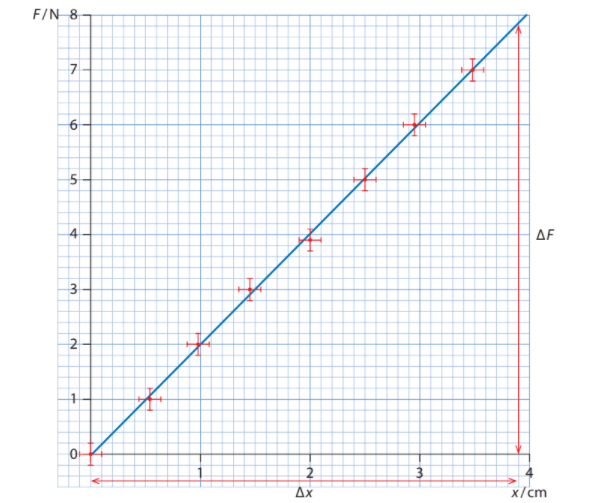
Uncertainty is often represented through error bars in graphs.

  • This uncertainty is usually found by determining the random error of a data set

The Minimum and Maximum lines are part of the line of best fit. They are found for linear lines

  • To draw the Minimum and Maximum lines, you draw a line such that it goes through all the error bars
  • If a line is not linear, it must be linearized to draw all the lines of best fit.

Leave a Comment

Subscribe to the Inertia Newsletter

IB News, Covid-19 Updates, Deadlines, Tips and Tricks, and Hundreds of Free Resources are Awaiting You!

Copyright © InertiaLearning, LLC. All rights reserved.

Share the joy with your friends:

Share on facebook
Facebook
Share on twitter
Twitter
Share on reddit
Reddit
Share on whatsapp
WhatsApp
Share on email
Email