#MAASL00092

[Maximum Mark: 6]

The box-and-whisker plot shows the number of points scored by players on a basketball team.

a) Find the value of the interquartile range.

b) One student scored  points, where . Given that  is an outlier, find the least value of .
#MAASL00019

[Maximum Mark: 7]

A group of 30 students took a survey. The survey revealed that 25 of them take
a math class and that 7 of them take a history class.

 and  represent the amount of students.


a) What are the values of  and ?

b) What is the probability that a randomly selected student is taking math but not history?
#MAASL00056
[Maxmimum Mark: 6]
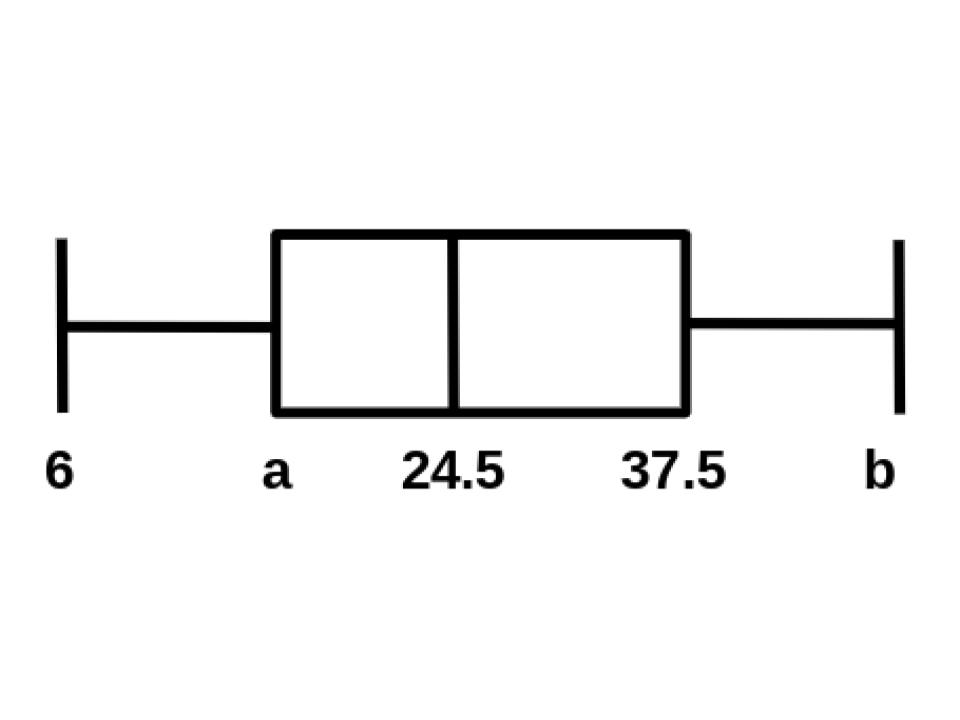
The diagram below is a box-and-whisker plot for a set of data.
The interquartile range is 21 and the range is 44.
a) Write down the median value.
b) Find the values of a and b.
#MAASL00144

[Maximum Marks: 6]

The following box-and-whisker plot represents the points scored on the Chemistry final.

a) Find the value of the Interquartile Range

b) A student scores  points, where . Given that  is an outlier, find the least value of
#MAASL00150
[Maximum Marks: 7]
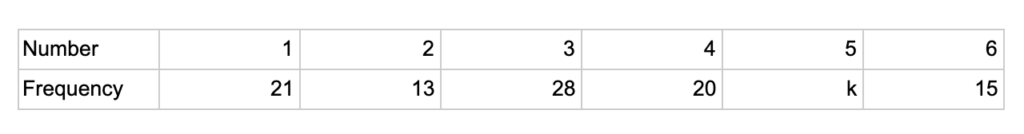
A box contains 100 cards. Each card has a number between one and six written on it.
The following table shows the frequencies for each number.
a) Calculate the value of k
b) Find
i) The median
ii) The Interquartile range
#MAASL00151
[Maximum Marks: 6]
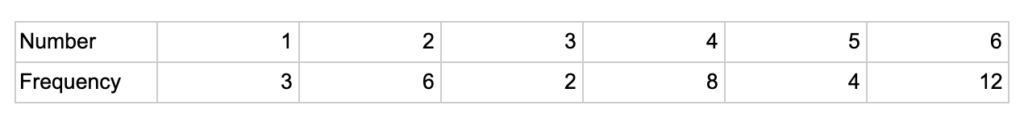
A standard die is rolled 35 times. The results are shown in the following table.
a) Write down the standard deviation.
b) Write down the median score.
c) Find the interquartile range.
#MAASL00152
[Maximum Marks: 7]
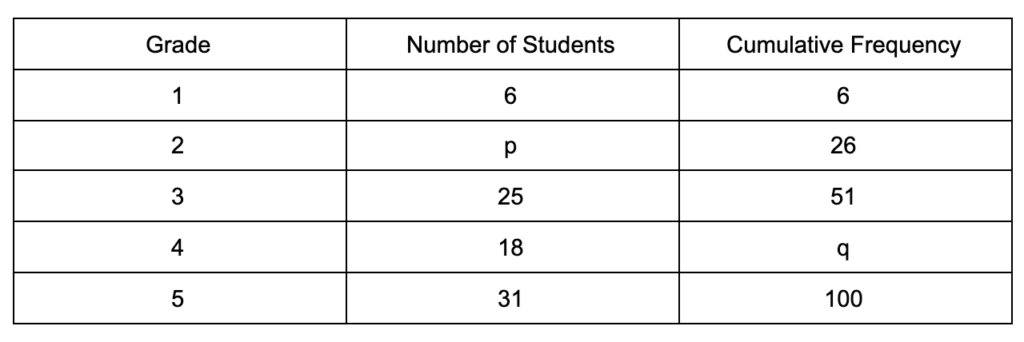
The following table gives the examination grades for 120 students.
a) Find the value of
i) p
ii) q
b) Find the mean grade
c) Write down the standard deviation
#MAASL00160

[Maximum Marks: 6]

This box-and-whisker plot shows the number of phone calls made by students in a school on a particular day.

a) Find the value of the interquartile range.

b) One student sent  phone calls, where  . Given that  is an outlier, find the least value of .
points, where
 points, where
  . Given that
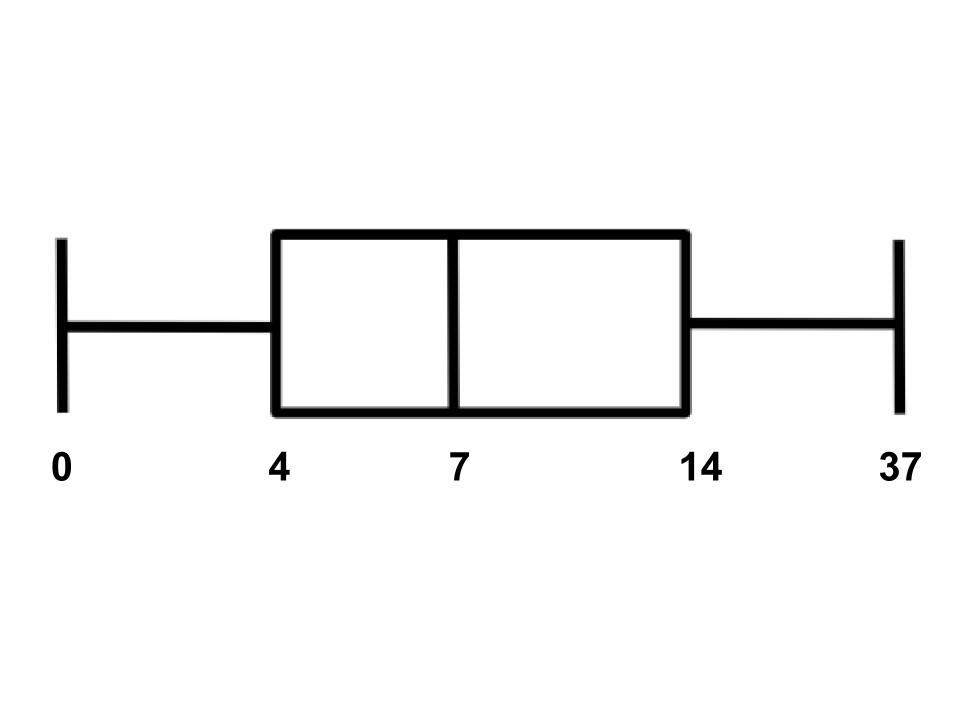
 and
and  represent the amount of students.
 a) What are the values of
  and
and  ?
b) What is the probability that a randomly selected student is taking math but not history?
?
b) What is the probability that a randomly selected student is taking math but not history? .
. represents the number of throws required to obtain a 1.
 , for
, for 

 points, where
  . Given that
 . Given that